| Abstract | Climate change in the future will continue to bring about unprecedented climate and climate extremes, and buildings and infrastructure will be exposed to them. To ensure that new and existing buildings deliver satisfactory performance over their design lives, their performance under current and future projected climates needs to be assessed by undertaking building simulations.
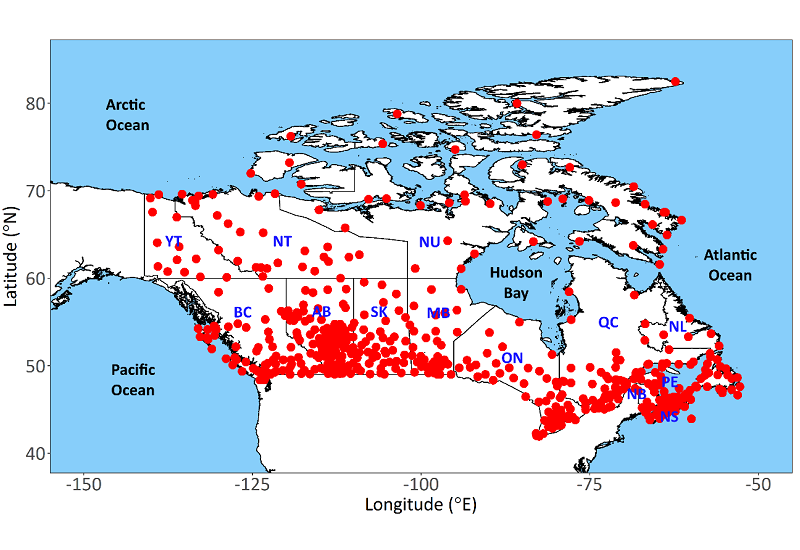
Reference years are one year (or a few years) prepared from the climate time series to capture aspects of interest from the long-term climate datasets. This database provides access to the following building simulation reference year files for 564 locations in Canada.
1. Typical Meteorological Year data for building energy applications are prepared using Sandia method (Hall et al. 1978; NREL 2008) by concatenating twelve typical meteorological months selected based on Finkelstein‐Schafer (FS) statistics.
2. Temperature reference years: Typical Downscaled Year, Extreme Cold Year, and Extreme Warm Year data are prepared following Nik (2016; 2017) by concatenating twelve typical, extreme cold, and extreme warm months respectively to capture the variability within the ensemble of climate model simulations.
3. Moisture Reference year data are prepared for hygrothermal applications. The median ranked year in terms of MI is selected as the conditioning year and the 10% level year is selected as the extreme year for hygrothermal applications.
The data are provided for a historical time-period: 1991-2021 and seven future time-periods coinciding with 0.5ºC, 1ºC, 1.5ºC, 2ºC, 2.5ºC, 3ºC, 3.5ºC of global warming. |
|---|